New numbers from Cisco allow us to update our previous comparison of actual Internet usage around the world. We think this is a far more useful metric than the usual “broadband connections per 100 inhabitants” used by the OECD and others to compile the oft-cited world broadband rankings.
What the per capita metric really measures is household size. And because the U.S. has more people in each household than many other nations, we appear worse in those rankings. But as the Phoenix Center has noted, if each OECD nation reached 100% broadband nirvana — i.e., every household in every nation connected — the U.S. would actually fall from 15th to 20th. Residential connections per capita is thus not a very illuminating measure.
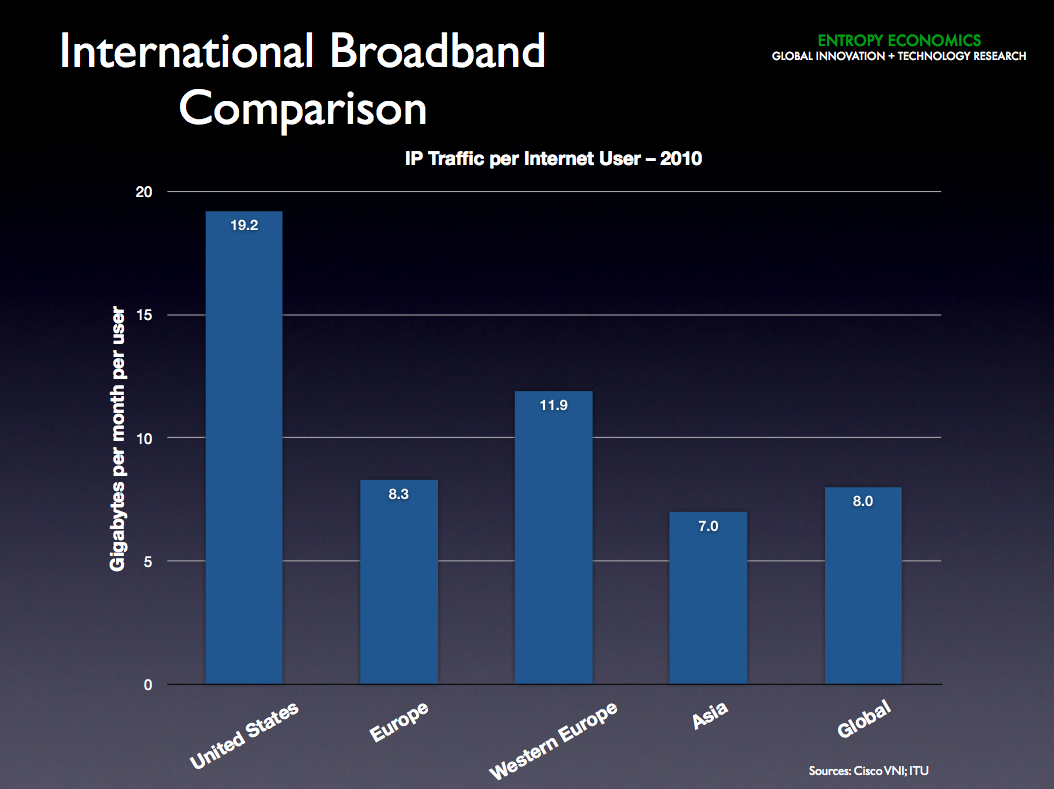
But look at the actual Internet traffic generated and consumed in the U.S.
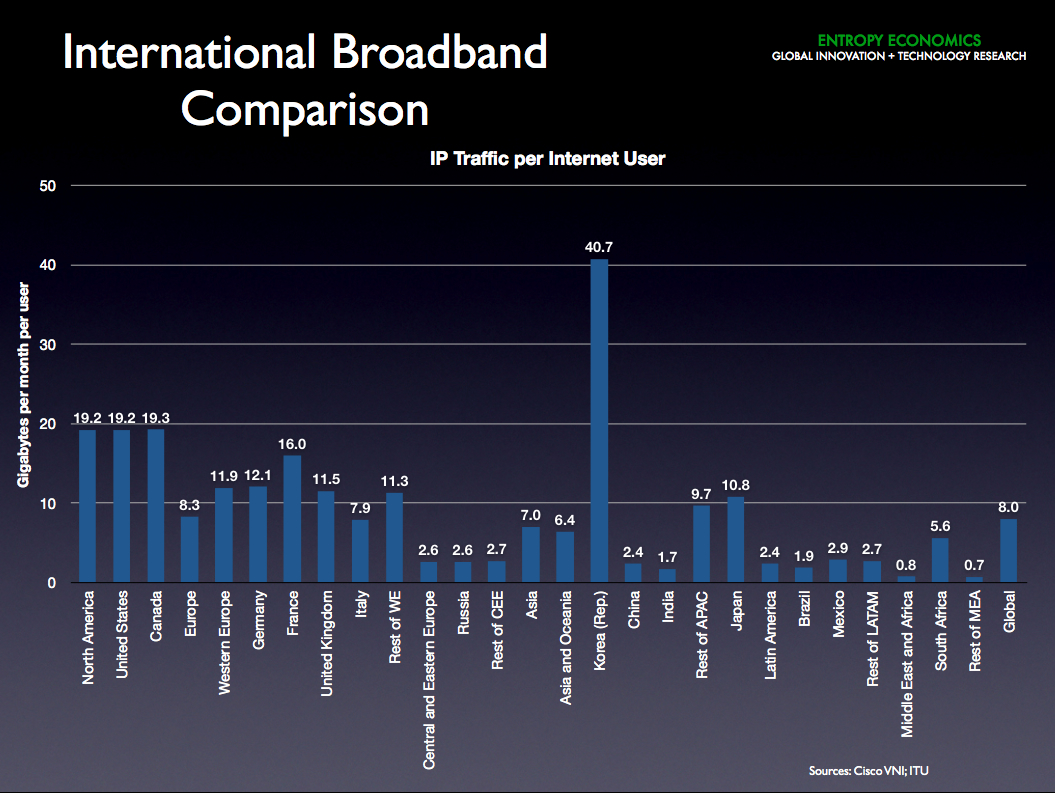
The U.S. far outpaces every other region of the world. In the second chart, you can see that in fact only one nation, South Korea, generates significantly more Internet traffic per user than the U.S. This is no surprise. South Korea was the first nation to widely deploy fiber-to-the-x and was also the first to deploy 3G mobile, leading to not only robust infrastructure but also a vibrant Internet culture. The U.S. dwarfs most others.
If the U.S. was so far behind in broadband, we could not generate around twice as much network traffic per user compared to nations we are told far exceed our broadband capacity and connectivity. The U.S. has far to go in a never-ending buildout of its communications infrastructure. But we invest more than other nations, we’ve got better broadband infrastructure overall, and we use broadband more — and more effectively (see the Connectivity Scorecard and The Economist’s Digital Economy rankings) — than almost any other nation.
The conventional wisdom on this one is just plain wrong.


