Category Archives: Uncategorized

Broadband facts: GON with the wind

See below our post from TechPolicyDaily.com responding to President Obama’s January 14 speech in Iowa. We’ve added some additional notes at the bottom of the post.

Yesterday, President Obama visited Cedar Falls, Iowa, to promote government-run broadband networks. On Tuesday, he gave a preview of the speech from the Oval Office. We need to help cities and towns build their own networks, he said, because the US has fallen behind the rest of the world. He pointed to a chart on his iPad, which showed many big US cities trailing Paris, Tokyo, Hong Kong, and Seoul in broadband speeds. Amazingly, however, some small US towns with government-owned broadband networks matched these world leaders with their taxpayer-funded deployment of gigabit broadband.

I wish I could find a more polite way to say this, but the President’s chart is utter nonsense. Most Parisians do not enjoy Gigabit broadband. Neither do most residents of Tokyo, Hong Kong, or Seoul, which do in fact participate in healthy broadband markets. Perhaps most importantly, neither do most of the citizens of American towns, like Cedar Falls, Chattanooga, or Lafayette, which are the supposed nirvanas of government-run broadband.*

The chart, which is based on a fundamentally flawed report, and others like it, deliberately obscures the true state of broadband around the world. As my AEI colleagues and I have shown, by the most important and systematic measures, the US not only doesn’t lag, it leads. The US, for example, generates two to three times the Internet traffic (per capita and per Internet user) of the most advanced European and Asian nations. (more…)

Commissioner Pai’s Netflix letter exposes fundamental flaws of Internet regulation

Combatants in the Net Neutrality wars often seem to talk past each other. Sometimes it’s legitimate miscommunication. More often, though, it arises from fundamental defects in the concept itself.

On December 2, Commissioner Ajit Pai wrote to Netflix, Inc., saying he “was surprised to learn of allegations that Netflix has been working to effectively secure ‘fast lanes’ for its own content on ISPs’ networks at the expense of its competitors.” Commissioner Pai noted press accounts that suggested Netflix’s Open Connect content delivery platform and its use of specialized video streaming protocols put video from non-Netflix sources at a disadvantage. Commissioner Pai concluded that “these allegations raise an apparent conflict with Netflix’s advocacy of strong net neutrality regulations” and thus asked for an explanation.

In its reply of December 11, Netflix made four basic points. Netflix (1) said it “designed Open Connect content delivery network (CDN) to provide consumers with a high-quality video experience”; (2) insisted “Open Connect is not a fast lane . . . . Open Connect helps ISPs reduce costs and better manage congestion, which results in a better Internet experience for all end users”; (3) said it “uses open-source software and readily-available hardware components”; and (4) applauded other firms for developing open video caching standards but “has focused” on its own proprietary system because it is more efficient and customer friendly than the collaborative industry efforts.

Three of Netflix’s four points are reasonable, as far as they go. The company is developing technologies and architectures to improve customer service and beat the competition. The firm, however, seems not to grasp Commissioner Pai’s central point: Netflix relishes aggressive competition on its own behalf but wants to outlaw similarly innovative behavior from the rest of the Internet economy.

(more…)

Phone Company Screws Everyone: Forces Rural Simpletons and Elderly Into Broadband, Locks Young Suburbanites in Copper Cage

Big companies must often think, damned if we do, damned if we don’t.

Netflix-Comcast Coverage

See our coverage of Comcast-Netflix, which really began before any deal was announced. Two weeks ago we wrote about the stories that Netflix traffic had slowed, and we suggested a more plausible explanation (interconnection disputes negotiations) than the initial suspicion (so called “throttling”). Soon after, we released a short paper, long in the works, describing “How the Net Works” — a brief history of interconnection and peering. And this week we wrote about it all at TechPolicyDaily, Forbes, and USNews.

Netflix, Verizon, and the Interconnection Question – TechPolicyDaily.com – February 13, 2014

How the Net Works: A Brief History of Internet Interconnection – Entropy Economics – February 21, 2014

Comcast, Netflix Prove Internet Is Working – TechPolicyDaily.com – February 24, 2014

Netflix, Comcast Hook Up Sparks Web Drama – Forbes.com – February 26, 2014

Comcast, Netflix and the Future of the Internet – U.S. News & World Report – February 27, 2014

— Bret Swanson

Reaction to “net neutrality” ruling

My AEI tech policy colleagues and I discussed today’s net neutrality ruling, which upheld the FCC’s basic ability to oversee broadband but vacated the two major, specific regulations.

Federal Court strikes down FCC “net neutrality” order

Today, the D.C. Federal Appeals Court struck down the FCC’s “net neutrality” regulations, arguing the agency cannot regulate the Internet as a “common carrier” (that is, the way we used to regulate telephones). Here, from a pre-briefing I and several AEI colleagues did for reporters yesterday, is a summary of my statement:

Chairman Wheeler has emphasized importance of Open Internet. We agree. The Internet is more open than ever — we’ve got more people, connected via more channels and more devices, to more content and more services than ever. And we will continue to enjoy an Open Internet because it benefits all involved — consumers, BSPs, content companies, software and device makers.

Chairman Wheeler has also emphasized recently that he believes innovation in multi-sided markets is important. At his Ohio State speech, he said we should allow experimentation, and when pressed on this apparent endorsement of multi-sided market innovation, he did not back down.

The AT&T “sponsored data” is a good example of such multi-sided market innovation, but one that many Net Neutrality supporters say violates NN. Sponsored Data, in which a content firm might pay for a portion of the data used by a consumer, increases total capacity, expands consumer choice, and would help keep prices lower than they would otherwise be. It also offers content firms a way to reach consumers. And it helps pay for cost of expensive broadband infrastructure. It is win-win-win.

Firms have already used this method — Amazon, for example, pays for the data downloads of Kindle ebooks.

Across the landscape, allowing technical and business model innovation is important to keep delivering diverse products to consumers at the best prices. Prohibiting “sponsored data” or tiered data plans or content partnerships or quality-of service based networking will reduce the flexibility of networks, reduce product differentiation, and reduce consumer choice. A rule that requires only one product or only one price level for a range of products could artificially inflate the price that many consumers pay. Low-level users may end up paying for high-end users. Entire classes of products might not come into being because a rule bans a crucial partnership that would have helped the product at its inception. Network architectures that can deliver better performance at lower prices might not arise.

Common carriage style regulation is not appropriate for the Internet. The Internet is a fast changing, multipurpose network, built and operated by numerous firms, with many types of data, content, products, and services flowing over it, all competing and cooperating in a healthy and dynamic environment. Old telephone style regulation, meant to regulate a monopoly utility that used a single purpose network to deliver one type of service, would be a huge (and possibly catastrophic) step backward for what is today a vibrant Internet economy.

The Court, though not ruling on the wisdom of Net Neutrality, essentially agreed and vacated the old-style common carriage rules. It’s a near-term win for the Internet. The court’s grant to the FCC of regulatory authority over the Internet, save common carriage, is, however, potentially problematic. We don’t know how broad this grant is or what the FCC might do with it. A fundamental rethink of our communications laws and regulations may thus be in order.

Crisis of Complexity

[W]e have these big agencies, some of which are outdated, some of which are not designed properly . . . . The White House is just a tiny part of what is a huge, widespread organization with increasingly complex tasks in a complex world.

That was President Obama, last week, explaining Obamacare’s failed launch. We couldn’t have said it better ourselves.

Where Washington thinks this is a reason to give itself more to do, with more resources, however, we see it as a blaring signal of overreach.

The Administration now says Healthcare.gov is operating with “private sector velocity and effectiveness.” But why seek to further governmentalize one-seventh of the economy if the private sector is faster and more effective than government?

Meanwhile, the New York Times notes that

The technology troubles that plagued the HealthCare.gov website rollout, may not have come as a shock to people who work for certain agencies of the government — especially those who still use floppy disks, the cutting-edge technology of the 1980s.

Every day, The Federal Register, the daily journal of the United States government, publishes on its website and in a thick booklet around 100 executive orders, proclamations, proposed rule changes and other government notices that federal agencies are mandated to submit for public inspection.

So far, so good.

It turns out, however, that the Federal Register employees who take in the information for publication from across the government still receive some of it on the 3.5-inch plastic storage squares that have become all but obsolete in the United States.

Floppy disks make us chuckle. But the costs of complexity are all too real.

A Bloomberg study found the six largest U.S. banks, between 2008 and August of this year, spent $103 billion on lawyers and related legal expenses. These costs pale compared to the far larger economic distortions imposed by metastasizing financial regulation. Even Barney Frank is questioning whether his signature law, Dodd-Frank, is a good idea. The bureaucracy’s decision to push regulations intended for big banks onto money managers and mutual funds seems to have tipped his thinking.

This is not an aberration. This is what happens with vast, complex, ambiguous laws, which ask “huge, widespread” bureaucracies to implement them.

It is the norm of today’s sprawling Administrative State and of Congress’s penchant for 2,000-page wish lists, which ineluctably empower that Administrative State.

We resist, however, the idea that the problem is merely “outdated” or “inefficient” bureaucracy.

We do not need better people to administer these “laws.” With laws and regulations this extensive and ambiguous, they are inherently political. The best managers would seek efficient and effective outcomes based on common-sense readings and would resist political tampering. Effective implementation of conflicting and economically irrational rules would still yield big problems. Regardless, the goal is not effective management — it is political control.

Agency “reform” is not the answer, although in most cases reform is preferable to no reform. Even reformed agencies do not possess the information to manage a “complex world.” Anyway, “competent” management is not what the political branches want. Agencies routinely evade existing controls — such as procurement rules — when convenient. The largest Healthcare.gov contractor, for example, reportedly got the work without any contesting bids. That is not an oversight, it is a decision.

The laws and rules are uninterpretable by the courts. Depending on which judges hear the cases, we get dramatically and unpredictably divergent analyses, or the type of baby splitting Chief Justice Roberts gave us on Obamacare. Judges thus end up either making their own law or throwing the question back into the political arena.

Infinite complexity of law means there is no law.

“With great power,” Peter Parker’s (aka Spiderman’s) uncle told us, “comes great responsibility.” For Washington, however, ambiguity and complexity are features, not bugs. Ambiguity and complexity promote control without accountability, power without responsibility.

The only solution to this crisis of complexity is to reform the very laws, rules, scope, and aims of government itself.

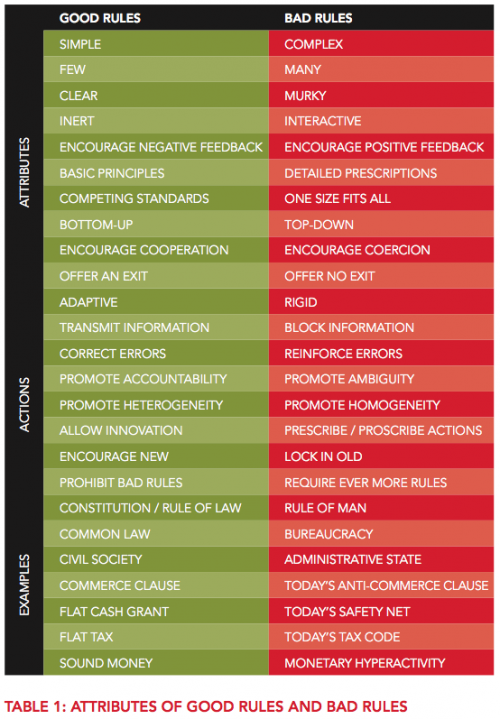
In a paper last spring called “Keep It Simple,” we highlighted two instances — one from the labor markets and one from the capital markets — where even the most well-intended rules yielded catastrophic results. We showed how the interactions among these rules and the supporting bureaucracies produced unintended consequences. And we outlined a basic framework for assessing “good rules and bad rules.”

As our motto and objective, we adopted Richard Epstein’s aspiration of “simple rules for a complex world.” Which, you will notice, is the just opposite of the problem so incisively outlined by the President — Washington’s failed attempts to perform “complex tasks in a complex world.”

As we wrote elsewhere,

The private sector is good at mastering complexity and turning it into apparent simplicity — it’s the essence of wealth creation. At its best, the government is a neutral arbiter of basic rules. The Administration says it is ‘discovering’ how these ‘complicated’ things can blow up. We’ll see if government is capable of learning.

The Need For Speed: How’s U.S. Broadband Doing?

My TechPolicyDaily colleague Roslyn Layton has begun a series comparing the European and U.S. broadband markets.

As a complement to her work, I thought I’d address a common misperception — the notion that American broadband networks are “pathetically slow.” Backers of heavier regulation of the communications market have used this line over the past several years, and for a time it achieved a sort of conventional wisdom. But is it true? I don’t think so.

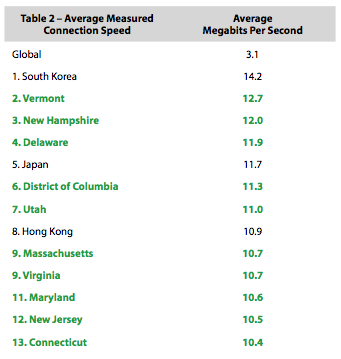
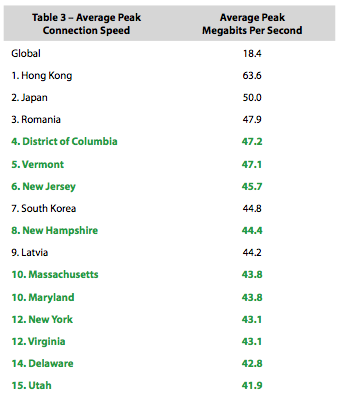
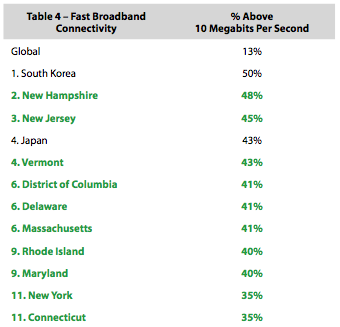
Real-time speed data collected by the Internet infrastructure firm Akamai shows U.S. broadband is the fastest of any large nation, and trails only a few tiny, densely populated countries. Akamai lists the top 10 nations in categories such as average connection speed; average peak speed; percent of connections with “fast” broadband; and percent of connections with broadband. The U.S., for example, ranks eighth among nations in average connection speed. And this is the number that is oft quoted. (This is a bit better than the no-longer-oft-used broadband penetration figures, which perennially showed the U.S. further down the list, at 15th or 26th place, for example.) Nearly all the the nations on these speed lists, however, with the exception of the U.S., are small, densely populated countries where it is far easier and more economical to build high-speed networks.

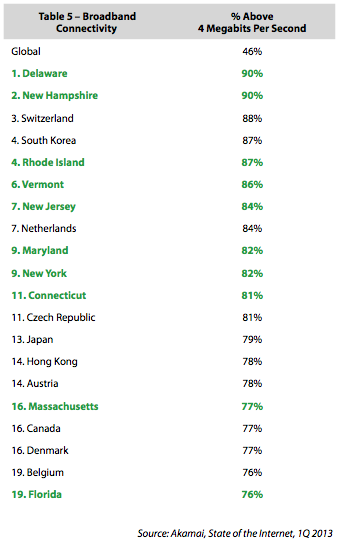
How to fix this? Well, Akamai also lists the top 10 American states in these categories. Because states are smaller, like the small nations that top the global list, they are a more appropriate basis for comparison. Last winter I combined the national and state figures and compiled a more appropriate comparative list. Using the newest data, I’ve updated the tables, which show that U.S. states (highlighted in green) dominate.

Average Connection SpeedAverage Peak Connection SpeedPercent Above 10 MbpsPercent Above 4 Mbps

Summarizing:

  • Ten of the top 13 entities for “average connection speed” are U.S. states.
  • Ten of the top 15 in “average peak connection speed” are U.S. states.
  • Ten of the top 12 in “percent of connections above 10 megabits per second” are U.S. states.
  • Ten of the top 20 in “percent of connections above 4 megabits per second” are U.S. states.

U.S. states thus account for 40 of the top 60 slots — or two-thirds — in these measures of actual global broadband speeds.

This is not a comprehensive analysis of the entire U.S. Less populated geographic areas, where it is more expensive to build networks, don’t enjoy speeds this high. But the same is true throughout the world.

Risk and Resilience

The U.S. Chamber of Commerce Foundation’s summer edition of the Business Horizon Quarterly is a special issue on the topic of “Resilience.” Our contribution is an essay called “Long Live the Risk Takers.”

Wealth, however, can be a double-edged sword. With wealth comes resilience and thus an increased capacity to take risk. More risk can lead to further riches. Yet greater wealth also increases potential losses. In other words, we have a lot more to gain and a lot more to lose.

Perhaps it is not surprising then that many modern elites and policymakers see danger around every corner—from terrorism to climate change to financial calamity. In one sense, an obsession with risk is a luxury of wealth. It is prudent to identify present shortcomings and contemplate future problems and attempt to avoid them. Preventing hunger, unemployment, bomb plots, wars, and financial panics is a good thing.

What happens, though, when we develop a hyper-focus on shortcomings and potential losses? What happens when we seek a public policy remedy for every perceived problem? This kind of obsession with risk, danger, and downside may be counterproductive. It may exacerbate known problems and unleash dangers never dreamed of.  . . . read the entire article.

Quote of the Day

The statute wants a competitive analysis, but as the Commission correctly points out, competition is not the goal, it the means.  Better performance is the goal.  When the evidence presented in the Sixteenth Report is viewed in this way, the conclusion to be reached about the mobile industry, at least to me, is obvious:  the U.S. mobile wireless industry is performing exceptionally well for consumers, regardless of whether or not it satisfies someone’s arbitrarily-defined standard of “effective competition.”

— George Ford, Phoenix Center chief economist, commenting on the FCC’s 16th Wireless Competition report.

Does Economic Growth Help the Middle Class?

That’s the question Jim Tankersley asked in a page one Washington Post story this week.

Here is how he summarized the situation:

“In the past three recoveries from recession, U.S. growth has not produced anywhere close to the job and income gains that previous generations of workers enjoyed. The wealthy have continued to do well. But a percentage point of increased growth today simply delivers fewer jobs across the economy and less money in the pockets of middle-class families than an identical point of growth produced in the 40 years after World War II.

That has been painfully apparent in the current recovery. Even as the Obama administration touts the return of economic growth, millions of Americans are not seeing an accompanying revival of better, higher-paying jobs.

The consequences of this breakdown are only now dawning on many economists and have not gained widespread attention among policymakers in Washington. Many lawmakers have yet to even acknowledge the problem. But repairing this link is arguably the most critical policy challenge for anyone who wants to lift the middle class.”

Tankersley cites the historical heuristic that a percentage point of GDP growth usually delivers about a half-point (0.5-0.6%) of employment growth.

“Three and a half years into the recovery that began in 2001 under President George W. Bush, job intensity was stuck at less than 0.2 percent. The recovery under President Obama is now up to an intensity of 0.3 percent, or about half the historical average.”

If we measure incomes, rather than employment, the situation appears even more dire:

“Middle-class income growth looks even worse for those recoveries. From 1992 to 1994, and again from 2002 to 2004, real median household incomes fell — even though the economy grew more than 6 percent, after adjustments for inflation, in both cases. From 2009 to 2011 the economy grew more than 4 percent, but real median incomes grew by 0.5 percent.”

What’s going on? Is the American middle class really in such bad shape? If so, why? And can we do anything about it? If not, why do these data appear to show a fundamental shift in the link between GDP growth and overall prosperity? These are big, complicated questions. For which I don’t have lots of concrete answers. I would, however, suggest a number of factors that may help us think about.

First, our economy does look different from the 1950s or 1960s. It is more complex. Back then, during a recession, factories laid off shifts of workers, leading to sharp employment downturns. Coming out of recessions, factories often hired back those same workers to build the same products. It was a simple process.

Today, although American manufacturing output is larger than ever, it employs a much smaller portion of the economy. The service and knowledge economies now dominate employment. And when jobs are not so closely tied to making widgets and the output is more ambiguous, the simple lay-off/hire-back formula disappears. In other words, we have lots more organizational and human capital today, and less “labor.”

This could be one reason the 1990 and 2001 recessions were shallower, but the job bounce-backs were slower.

Another factor, which everyone points out, is education. The United States may dominate many of the high-end professions in technology and finance because we have large cohorts of highly educated people (and immigrants). During the Great Recession and its aftermath, for example, the new App Economy, based on smartphones, broadband, and software, has created an estimated 500,000-600,000 jobs. Perhaps an also large cohort, however, not nearly as well educated or without the necessary knowledge skills, has been caught in a two-decade wave of globalization that quickly reduced the jobs this cohort was used to doing, without the possibility for quick changes to higher-value industries.

The Great Recession, however, was deeper and its employment rebound slower than the 1990 and 2001 recessions.

So we look to other factors that appear to be suppressing employment. In his new book The Redistribution Recession, University of Chicago economist Casey Mulligan argues that a host of well-intended safety-net programs are the chief culprit. Unemployment insurance, disability payments, the minimum wage, Medicaid, the earned income tax credit, food stamps and other programs can create deep disincentives to work and/or hire. Mulligan estimated that the average marginal tax rate on the relevant population increased eight percentage points, from 40% to 48%, during the Great Recession. For many individuals and families, the complex effects of these programs conspire to yield 100% marginal tax rates — that is, an extra dollar earned loses a dollar or more in benefits and taxes.

I would throw out another possible factor: monetary policy. The Fed’s unorthodox zero-interest-rate-plus-bond-buying policy has created free money for large firms and for government. We see government growing and corporate profits at record highs. But for small and medium-sized firms, credit is being rationed by regulators. Low rates are meaningless if credit is unavailable. The slow recovery for small firms, which are often acknowledged to create most jobs, could be part of the equation.

Switching from employment to income, a few factors are commonly mentioned:

  • Education and globalization may, as with employment, be boosting income for the top but limiting income prospects for the broad middle.
  • Health care and other benefits are rising as a portion of overall compensation, thus limiting the measured portion that we call wages or salaries.
  • Immigration has added millions of low-wage workers that may depress average measured incomes. These particular workers may be much better off than they were in their home countries and, by lowering wages for jobs few Americans want to do, may “harm” only a very small number of Americans.
  • Many income measures do not account for taxes and larger transfer payments in recent times through EITC, Medicaid, disability, unemployment, food stamps, etc. When these are factored in, the numbers look much different.

Alan Reynolds made the case for these underestimates in his 2006 book, Income and Wealth. And now Bruce D. Meyer of the University of Chicago and James X. Sullivan of Notre Dame find that median income growth has not suffered nearly as much as the conventional wisdom says.

“After appropriately accounting for inflation, taxes, and noncash benefits, we show that median income rose by more than 50 percent over the past three decades. This increase is considerably greater than the gains implied by official statistics—official median income rose by only 14 percent between 1980 and 2009. Our improved measure of income increased in each of the past three decades, although the growth has been much slower since 2000. Median consumption also rose at a similar rate over the whole period but at a faster rate than income over the past decade.”

The real income slowdown in the 2000s is not surprising. The decade included two recessions—including the big one. The decade also saw, for the first time since the 1970s, a good whiff of inflation, especially in food, fuel, and housing. Add in spiraling health care and education costs. So, despite spectacular gains in computers, communications, and consumer goods, the middle class squeeze often seems real.

Mark Perry and Don Boudreaux, however, are even more emphatic than Meyer and Sullivan. They say the “trope” of the stagnant middle class is “spectacularly wrong”:

“It is true enough that, when adjusted for inflation using the Consumer Price Index, the average hourly wage of nonsupervisory workers in America has remained about the same. But not just for three decades. The average hourly wage in real dollars has remained largely unchanged from at least 1964—when the Bureau of Labor Statistics (BLS) started reporting it.

“Moreover, there are several problems with this measurement of wages. First, the CPI overestimates inflation by underestimating the value of improvements in product quality and variety. Would you prefer 1980 medical care at 1980 prices, or 2013 care at 2013 prices? Most of us wouldn’t hesitate to choose the latter.

“Second, this wage figure ignores the rise over the past few decades in the portion of worker pay taken as (nontaxable) fringe benefits. This is no small matter—health benefits, pensions, paid leave and the rest now amount to an average of almost 31% of total compensation for all civilian workers according to the BLS.

“Third and most important, the average hourly wage is held down by the great increase of women and immigrants into the workforce over the past three decades. Precisely because the U.S. economy was flexible and strong, it created millions of jobs for the influx of many often lesser-skilled workers who sought employment during these years.”

Perry and Boudreaux go on to say that no income figures—whether the officially stagnant ones or the higher adjusted figures—can account for the dramatic rise in the quantity and quality of consumption that income yields.

Bill Gates in his private jet flies with more personal space than does Joe Six-Pack when making a similar trip on a commercial jetliner. But unlike his 1970s counterpart, Joe routinely travels the same great distances in roughly the same time as do the world’s wealthiest tycoons.

What’s true for long-distance travel is also true for food, cars, entertainment, electronics, communications and many other aspects of ‘consumability.’ Today, the quantities and qualities of what ordinary Americans consume are closer to that of rich Americans than they were in decades past. Consider the electronic products that every middle-class teenager can now afford—iPhones, iPads, iPods and laptop computers. They aren’t much inferior to the electronic gadgets now used by the top 1% of American income earners, and often they are exactly the same.”

Despite all the factors in this multifaceted debate, one thing is certain. Economic growth is better for the middle class than is economic stagnation.


Zero GDP Reading Exposes the Real Deficit – Economic Growth

It is currently in fashion to say, with great contrarian flair, that federal spending growth is the slowest since the Eisenhower Administration. Or, as someone famous recently put it, “We don’t have a spending problem.”

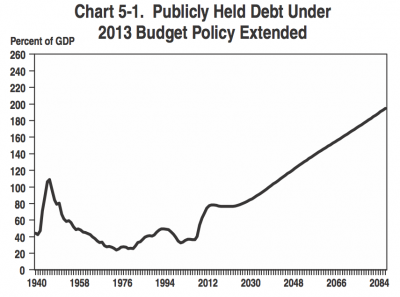
This assertion is, to put it mildly, debatable. Spending jumped 18% in just one year during the Panic of 2008-09. If the government keeps spending at that level, but starts counting after the jump, then the growth rate will appear modest. Spending as a share of GDP is higher than at anytime since World War II, and so is the debt-to-GDP ratio. As the OMB chart below shows, it gets much worse.

Nevertheless, does anyone disagree that we have a growth problem, and a serious one? Yesterday’s negative GDP estimate for the fourth quarter of 2012 (-0.1%) should jolt the nation.

Let’s stipulate the GDP reading’s anomalies — lower than expected inventories and defense spending, which could reverse and add a bit to future growth. Yet economists had expected fourth quarter growth of 1.1% — itself an abysmal projection — and actual growth for the entire year was a barely mediocre 2.2%. Consider, too, that lots of economic activity was moved forward into 2012 to beat the Fiscal Cliff taxman. And don’t forget the Federal Reserve’s extraordinary QE programs, which are supposed to boost growth.

Whatever we’re doing, it’s not working. Not nearly well enough to create jobs. And not nearly well enough to help the budget. Because whatever you think about spending or taxes, the key factor in the health of the budget is economic growth.

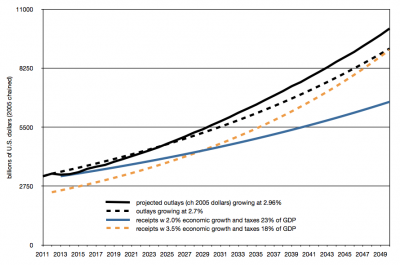
OMB projects spending will grow (from today’s historically high level) around 2.96% per year through 2050. It projects annual economic growth over the period of 2.5%. That gets us a debt crisis somewhere down the line, and lots of other economic and social problems along the way.

Last year, however, keep in mind, growth was just 2.2%, following 2011’s even worse reading of 1.8%. If we can’t even match the modest 2.5% long-term projection coming out of a severe downturn, our problems may be worse than we think. Economist Robert Gordon of Northwestern asks “Is U.S. Growth Over?” Outlining seven economic headwinds, he projects growth of around 1.5% over the next few decades. In the chart below, you can see what a budget disaster such a slowdown would produce. Deficits quickly grow from a trillion dollars a year today into the many trillions per year.

Perhaps, many are now suggesting, we can tax our way out of the problem. Almost all academic research, however, suggests higher taxes (in terms of rates and as a portion of the economy) hurt economic growth. The Tax Foundation, for example, surveyed the 26 major studies on the topic going back to the early 1980s. Twenty-three of the studies found that taxes hurt economic growth. No study found higher taxes helped growth. Recent experience in Europe tends to confirm these findings.

Today, most of the policy discussion revolves around debt ceilings, sequesters, and the (fading) possibility of grand bargain budget deal. Mostly lost in the equation is economic growth. One question should dominate the thinking of policymakers: What policies would encourage more productive economic activity?

The new possibility of a breakthrough on immigration reform is an encouraging example. A more rational immigration policy for both low-skilled and high-skilled workers could boost economic growth significantly. Can we find more such policies? As you can see in the chart below, higher taxes can’t make up the budget shortfall. Faster growth and modest spending restraint can. This chart once again shows the OMB projected spending path (solid black line). The solid blue line shows what would happen to tax receipts if (1) growth remains mediocre and (2) we somehow find a way to dramatically raise the portion of the economy Washington taxes from the historical 18% to 23%.

That’s a major jump in taxation. Yet it doesn’t get us close to a healthy budget.

Faster growth and modest spending restraint, on the other hand, close the budget gap. And they do so without increasing the share Washington historically takes from the economy. The orange dashed line shows tax receipts under an economy growing at 3.5% with the historic 18% tax-to-GDP ratio. (Growth of 3.5% may sound like an ambitious goal. Keep in mind, however, that we are still far below trend — we’ve never really recovered from the Great Recession. Long term growth of 3.5%, therefore, merely includes a more rapid recovery to trend over the next several years and then a resumption of the long-term average of 3%.) In the medium to long term, a faster growth-lower tax regime generates more tax revenue than a slow growth-high tax regime.

Faster growth alone would be enough to stabilize budget deficits at today’s levels. But that is not enough. Trillion dollar deficits and Washington spending an ever rising share of the economy are not acceptable. Look, however, at the very modest spending restraint that would be required to essentially balance the budget by 2050. If we slowed spending growth from the projected 2.96% annual rate to just 2.7%, we could close the gap.

Does anyone think spending growth of 2.7% per year versus 2.96% is going to tear apart Social Security, Medicare, the military, or other essential government functions. Many of us could imagine responsible ways to reduce projected spending far, far more than that. All this shows is that a little restraint and robust economic growth go a long way.

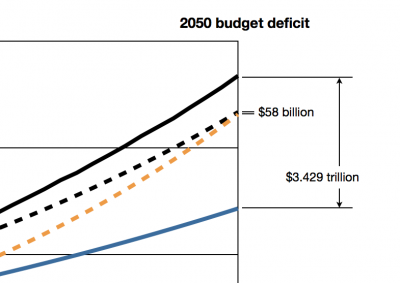
The slow growth-high tax scenario produces a budget deficit of almost $3.5 trillion in 2050. Under the faster growth-lower tax scenario, with a touch of spending restraint, the 2050 budget deficit would be just $58 billion.

Now, I’m not pretending I know that a higher tax-to-GDP ratio will produce a particular rate of economic growth. The above are just rough scenarios. Lots of factors are in play. And that is precisely the point. Given an complex, uncertain world, we should attempt to align all our policies for economic growth. We know what policies tend to encourage growth, and those that tend to stunt it.

That means getting immigration policy right — and it appears we may finally be getting somewhere. It means smart, reasonable regulatory policies in energy, health care, education, communications, and intellectual property. It means a healthy division of powers between the federal and state governments. And, yes, it means sweeping tax reform — both individual and corporate.

What we are doing today isn’t working. We are on a dangerous path. Two percent growth won’t get us anywhere. No matter how much we tax ourselves. Only robust growth fueled by entrepreneurship and investment, with a healthy faith in the unknown possibilities of America’s future, will get us there.

Ignorance, the Ultimate Asset

Grab a cup of coffee and check out our new article at The American, the online magazine of the American Enterprise Institute.

“Ignorance, the Ultimate Asset”

“Deck the Halls with Macro Follies” – featuring Jean-Baptiste Say!

The App Economy, so far

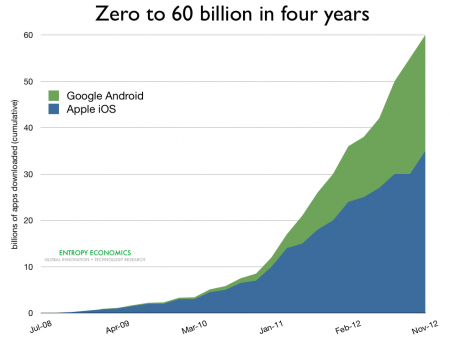
See our new report summarizing the short but amazing life of the mobile app: Soft Power: Zero to 60 Billion in Four Years.

Memos to the Future: 2042

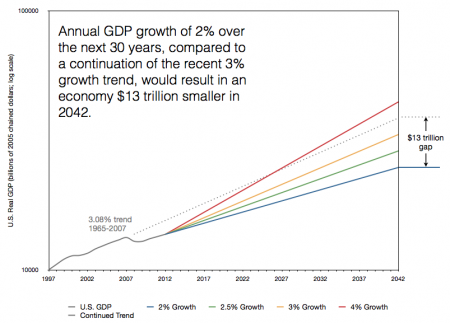
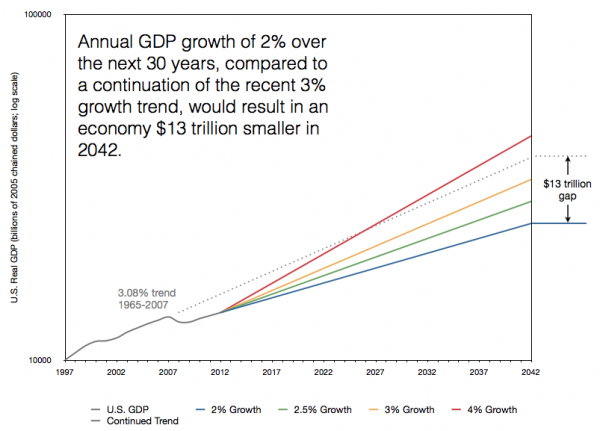
What would “the New Normal” of a mere 1% per capita GDP growth mean for the American economy over the next few decades?  What if it’s even worse, as many are now predicting? Is there anything we can do about it? If so, what? We address these items in our new article for the Business Horizon Quarterly — “Beyond the New Normal, a New Era of Growth.”

This kind of “prosperity” isn’t good enough

Today, Princeton’s Alan Blinder says things are looking up, that we’re finally traveling the road to prosperity, albeit slowly. It’s a rather timid claim:

there are definitely positive signs. The stock market is near a five-year high. Recent data on consumer spending and confidence show improvement, though we need more data before declaring victory. At long last, the housing market is growing rapidly, albeit from a very low base . . . .

On balance, the U.S. economy is healing its wounds—that’s another fact. But none of this puts us on the verge of an exuberant boom. Still, if the fiscal cliff is avoided and the European debt crisis doesn’t explode in our face, both GDP growth and job growth should be higher in 2013 than in 2012—even under current policies. But that’s a forecast, not a fact.

Stanford’s John Taylor counters some of Blinder’s claims:

First, he admits that real GDP growth—the most comprehensive measure we have of the state of the economy—is declining; that’s not an improvement.

Second, he admits that, according to the payroll survey, job growth isn’t faster in 2012 than 2011; that’s not an improvement either.

Third, he mentions that the household survey shows employment growth is faster, but that growth must be measured relative to a growing population. If you look at the employment to population ratio, it is the same (58.5%) in the 12 month period starting in October 2009 (the month he chooses as the low point) as in the past 12 months. That’s not an improvement.

Fourth, he shows that the unemployment rate is coming down. But much of that improvement is due to the decline in the labor force participation rate as people drop out of the labor force. According to the CBO, unemployment would be 9 percent if that unusual and distressing decline–certainly not an improvement–had not occurred.

He then goes on to consider forecasts, saying that there are promising signs, such as the housing market. The problem here, however, is that growth is weakening even as housing is less of a drag, because other components of GDP are flagging.

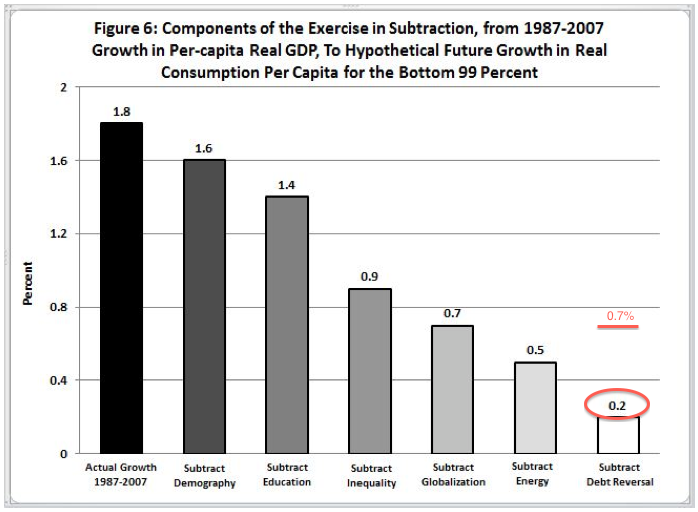
Meanwhile, there is Northwestern’s Bob Gordon, who is making a much stronger, longer term forecast — that the next several decades will be pretty awful. Specifically, that real U.S. economic growth is likely to halve — or worse — from its recent and historical trend of about 2% per-capita per-year.

We’ve been emphasizing just how important it is to get the economy moving again, and how important long term growth is for jobs, incomes, overall opportunity, and for governmental budgets. The Gordon scenario is even worse than the so-called New Normal of around 1% per-capita growth (or 2% overall growth). Gordon projects per-capita growth over the next few decades of around 0.7%. (In non-per-capita terms, the way GDP figures are most often reported, that’s about 1.7%). He thinks growth for the “99%” will be far worse — just 0.2% per-capita.

In the chart below, you can see just how devastating a New Normal scenario would be, let alone Gordon’s even more pessimistic projection. It’s urgent that we implement a sweeping new set pro-growth reforms on taxes, regulation, immigration, trade, education, and monetary policy.

Discussing Broadband Via Broadband

It was nice of Ball State University’s Digital Policy Institute (@DigitalPolicy) to include me last Friday  in a webinar discussion on broadband policy. Joining the virtual discussion were Leslie Marx, of Duke and formerly FCC chief economist; Anna-Maria Kovacs, well-known regulatory analyst and fellow at Georgetown; and Michael Santorelli of New York Law School.

You can find a replay of the webinar here. Our broadband discussion, which begins at 1:55:48, was preceded by a good discussion of consumer online privacy, which you might also enjoy.

Flashback: “there is no inherent shortage of oil”

The energy boom is an apparent surprise to many. I don’t know why. Here’s the photo, caption, and story right now (Wednesday night) on the front page of  The Wall Street Journal :

Here was our take in 2006:

there is no inherent shortage of oil. One tiny shale formation right in America’s backyard — the 1,200 square mile Piceance Basin of western Colorado — contains a trillion barrels, more than all the proven reserves in the world. Vast open spaces across the globe remain unexplored or untapped.

Today, it’s Dakota, Texas, and Pennsylvania shale that is leading the new boom. As a few smart guys wrote, we have a “bottomless well” of energy, if only we allow ourselves to find, refine, and innovate.

A Policy Path to Internet 2020

Optical fiber versus copper, no contest.

Life’s only certainty is change. Nowhere more true than with modern technologies, particularly broadband. Problem is, lots of government rules are not coming along for the ride.

Yesterday the Communications Liberty and Innovation Project (CLIP) hosted regulatory experts to discuss ways the FCC might incent more investment in digital infrastructure.

A fresh voice at the FCC is focusing the agency and the country on such a policy path of abundant wired and wireless broadband. New FCC Commissioner Ajit Pai (@AjitPaiFCC) yesterday called for the creation of an IP Transition Task Force as a way to accelerate the transition from analog networks to faster and more ubiquitous digital networks. Network providers, he said, want to know how IP services will be regulated before making major infrastructure investments. Commissioner Pai also discussed economic growth and job creation, asserting every $1 billion spent on fiber deployment creates between 15,000 and 20,000 jobs. Therefore to pave the way for robust private sector investment in the IP infrastructure, the FCC must signal a clear intention not to apply outdated 20th century regulations to these 21st century technologies.

The follow-up discussion focused on the need for a regulatory framework that will promote competition and economic growth while also maximizing consumer benefits. Jonathan Banks of US Telecom pointed out that the telecommunications industry is investing $65 billion per year, every year, in broadband infrastructure — a huge boost to current and future economic growth. Whoever occupies the White House after November should make it clear that expanding the nation’s “infostructure” with private investment dollars is a key national priority that will generate huge dividends — digital and otherwise.

« Previous PageNext Page »