 AT&T’s announced purchase of T-Mobile is an exaflood acquisition — a response to the overwhelming proliferation of mobile computers and multimedia content and thus network traffic. The iPhone, iPad, and other mobile devices are pushing networks to their limits, and AT&T literally could not build cell sites (and acquire spectrum) fast enough to meet demand for coverage, capacity, and quality. Buying rather than building new capacity improves service today (or nearly today) — not years from now. It’s a home run for the companies — and for consumers.
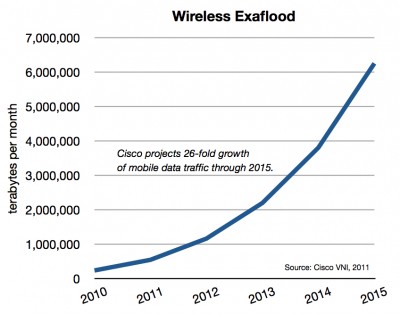
We’re nearing 300 million mobile subscribers in the U.S., and Strategy Analytics estimates by 2014 we’ll add an additional 60 million connected devices like tablets, kiosks, remote sensors, medical monitors, and cars. All this means more connectivity, more of the time, for more people. Mobile data traffic on AT&T’s network rocketed 8,000% in the last four years. Remember that just a decade ago there was essentially no wireless data traffic. It was all voice traffic. A few rudimentary text applications existed, but not much more. By year-end 2010, AT&T was carrying around 12 petabytes per month of mobile traffic alone. The company expects another 8 to 10-fold rise over the next five years, when its mobile traffic could reach 150 petabytes per month. (We projected this type of growth in a series of reports and articles over the last decade.)
The two companies’ networks and businesses are so complementary that AT&T thinks it can achieve $40 billion in cost savings. That’s more than the $39-billion deal price. Those huge efficiencies should help keep prices low in a market that already boasts the lowest prices in the world (just $0.04 per voice minute versus, say, $0.16 in Europe).
But those who focus only on the price of existing products (like voice minutes) and traditional metrics of “competition,” like how many national service providers there are, will miss the boat. Pushing voice prices down marginally from already low levels is not the paramount objective. Building fourth generation mobile multimedia networks is. Some wonder whether “consolidation of power could eventually lead to higher prices than consumers would otherwise see.” But “otherwise” assumes a future that isn’t going to happen. T-Mobile doesn’t have the spectrum or financial wherewithal to deploy a full 4G network. So the 4G networks of AT&T, Verizon, and Sprint (in addition to Clearwire and LightSquared) would have been competing against the 3G network of T-Mobile. A 3G network can’t compete on price with a 4G network because it can’t offer the same product. In many markets, inferior products can act as partial substitutes for more costly superior products. But in the digital world, next gen products are so much better and cheaper than the previous versions that older products quickly get left behind. Could T-Mobile have milked its 3G network serving mostly voice customers at bargain basement prices? Perhaps. But we already have a number of low-cost, bare-bones mobile voice providers.
The usual worries from the usual suspects in these merger battles go like this: First, assume a perfect market where all products are commodities, capacity is unlimited yet technology doesn’t change, and competitors are many. Then assume a drastic reduction in the number of competitors with no prospect of new market entrants. Then warn that prices could spike. It’s a story that may resemble some world, but not the one in which we live.
The merger’s boost to cell-site density is hugely important and should not be overlooked. Yes, we will simultaneously be deploying lots of new Wi-Fi nodes and femtocells (little mobile nodes in offices and homes), which help achieve greater coverage and capacity, but we still need more macrocells. AT&T’s acquisition will boost its total number of cell sites by 30%. In major markets like New York, San Francisco, and Chicago, the number of AT&T cell sites will grow by 25%-45%. In many areas, total capacity should double.
It’s not easy to build cell sites. You’ve got to find good locations, get local government approvals, acquire (or lease) the sites, plan the network, build the tower and network base station, connect it to your long-haul network with fiber-optic lines, and of course pay for it. In the last 20 years, the number of U.S. cell sites has grown from 5,000 to more than 250,000, but we still don’t have nearly enough. CEO Randall Stephenson says the T-Mobile purchase will achieve almost immediately a network expansion that would have taken five years through AT&T’s existing organic growth plan. Because of the nature of mobile traffic — i.e., it’s mobile and bandwidth is shared — the combination of the two networks should yield a more-than-linear increase in quality improvements. The increased cell-site density will give traffic planners much more flexibility to deliver high-capacity services than if the two companies operated separately.
The U.S. today has the most competitive mobile market in the world (second, perhaps, only to tiny Hong Kong). Yes, it’s true, even after the merger, the U.S. will still have a more “competitive” market than most. But “competition” is often not the most — or even a very — important metric in these fast moving markets. In periods of undershoot, where a technology is not good enough to meet demand on quantity or quality, you often need integration to optimize the interfaces and the overall experience, a la the hand-in-glove paring of the iPhone’s hardware, software, and network. Streaming a video to a tiny piece of plastic in your pocket moving at 60 miles per hour — with thousands of other devices competing for the same bandwidth — is not a commodity service. It’s very difficult. It requires millions of things across the network to go just right. These services often take heroic efforts and huge sums of capital just to make the systems work at all.
Over time technologies overshoot, markets modularize, and small price differences matter more. Products that seem inferior but which are “good enough” then begin to disrupt state-of-the art offerings. This was what happened to the voice minute market over the last 20 years. Voice-over-IP, which initially was just “good enough,” made voice into a commodity. Competition played a big part, though Moore’s law was the chief driver of falling prices. Now that voice is close to free (though still not good enough on many mobile links) and data is king, we see the need for more integration to meet the new challenges of the multimedia exaflood. It’s a never ending, dynamic cycle. (For much more on this view of technology markets, see Harvard Business School’s Clayton Christensen).
The merger will have its critics, but it seriously accelerates the coming of fourth generation mobile networks and the spread of broadband across America.
— Bret Swanson

